Finance: Shedding Light On The Intersection Of Crypto And FX Candlestick Patterns
Cryptocurrency and forex trading are two of the most popular forms of trading in the financial markets. While both involve the buying and selling of assets, there are some critical differences between them. One of these is the use of candlestick patterns to analyze price movements. This article will compare crypto and forex trading to see if their candlestick patterns are similar or different. We will also discuss how traders can use these patterns to make informed decisions when trading either asset class.
Exploring the Similarities Between Crypto and Forex Candlestick Patterns
While the candlestick patterns in both the crypto and forex markets have some differences, there are also many similarities. For example, both markets use candlesticks to represent price movements over a given period of time. The shape of the candlestick can tell you whether the market is bullish or bearish, as well as how strong the trend is.
Furthermore, both markets use similar chart patterns, such as head and shoulders, double tops/bottoms, and triangles. These patterns can help traders identify their trades' potential entry and exit points. Furthermore, both markets use support and resistance levels to determine when to enter or exit a trade. Finally, both markets have similar indicators, such as moving averages and oscillators, that can be used to identify trends and make trading decisions.
Utilizing Candlestick Analysis to Make Informed Decisions in Crypto and Forex Trading
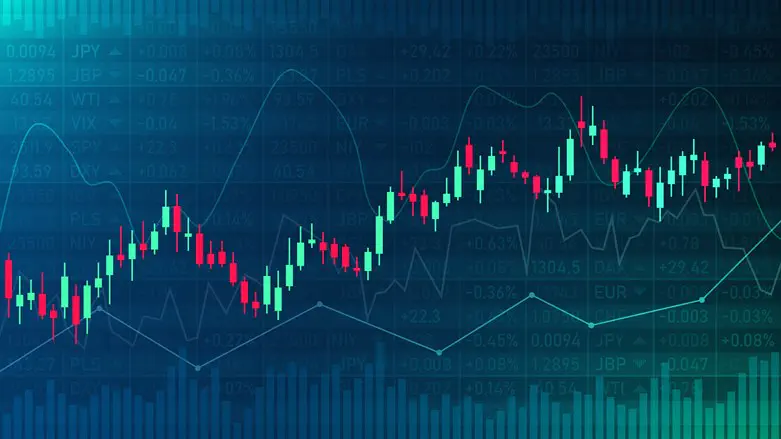
To use candlestick analysis effectively, you need to understand how it works. A candlestick chart consists of individual candles representing the price action over a given period. Each candle has four components: open, high, low, and close. The open is the price at which the candle opened, while the close is the price at which it closed. The high is the highest price reached during that period, while the low is the lowest price reached during that period.
Now, if a candle closes higher than its open, this could indicate bullish sentiment in the market and may be an opportunity to buy or go long on a currency pair or cryptocurrency. On the other hand, if a candle closes lower than its open, this could indicate bearish sentiment in the market and may be an opportunity to sell or go short on a currency pair or cryptocurrency. Candlestick analysis can also be used to identify support and resistance levels in markets as well as potential reversal patterns such as head-and-shoulders or double tops/bottoms.
By combining technical indicators with candlestick analysis, traders can gain valuable insights into market movements and make more informed decisions when trading crypto or forex assets.
