

The world of financial markets can shift in moments, and newcomers often find themselves drowning in a sea of numbers, charts, and terminology. But as often happens on the high seas, new traders do have a rescue option — candlestick patterns. Today, candlestick charts serve as the foundation for technical analysis across global markets, from Wall Street to Tokyo, offering insights based on factual data.
What Makes a Candlestick Chart
Every candlestick captures four critical price points: where trading began (opening price), where it concluded (closing price), the highest point reached during the session (high), and the lowest point touched (low).
The color coding system provides immediate visual feedback about market direction. Green or white candles typically mean bullish activity where the closing price exceeds the opening one. This suggests that buying pressure dominates the session. Conversely, red or black candles stand for bearish activity when sellers push prices lower than the opening level.
Why Candlestick Patterns Matter
When a specific candlestick pattern emerges throughout market history, it creates signals traders can rely on to anticipate future price movements. Still, to read the signals correctly, a visual graph alone will not be enough — traders also need to analyze their context within broader market trends.
Essential Single Candlestick Patterns
Besides their reliance on broader market context, candlestick patterns fall under several categories.
The Doji Family
The Doji is one of the most significant single candlestick formations, characterized by opening and closing prices that are nearly identical. This creates a small body with shadows extending in either direction, similar to a cross or plus sign. The appearance of a Doji suggests market indecision, where neither buyers nor sellers have decisive control during the trading session.
Different variations of the Doji can also carry distinct meanings. The Dragonfly Doji features a long lower shadow with little to no upper shadow. It often appears at market bottoms to signal potential bullish reversals. The Gravestone Doji shows the opposite structure with a long upper shadow. This type frequently marks market tops and indicates possible bearish turns.
Hammer and Hanging Man Patterns
The Hammer pattern emerges during downtrends and suggests potential bullish reversals. It has a small body near the top of the candle with a long lower shadow that should be at least twice the length of the body; in this case, there is no upper shadow or only a minimal one. This graph indicates that despite initial selling pressure driving prices lower and buyers are stepping in to push prices back to the opening level.
The Hanging Man looks very much like the Hammer but occurs at the end of uptrends and serves as a bearish warning signal. And that is the trick of reading charts — both patterns share the same visual characteristics, but their interpretation depends entirely on the preceding trend context.
The Shooting Star Formation
A stock candlestick pattern that frequently signals bearish reversals is the Shooting Star. This graph features a small body near a long upper shadow, and appears after an uptrend. The formation suggests that buyers initially drove prices higher during the session, but sellers regained control and pushed prices back down near the opening level.
Market technicians consider the Shooting Star especially significant when it appears at previous resistance levels or after extended rallies. This pattern implies potential buyer exhaustion and warns that the uptrend may be losing momentum.
How to Master Multiple Candlestick Formations
Besides the three major patterns described above, a few more formations may hint at changing market dynamics.
Engulfing Patterns
Candlestick pattern trading strategies often emphasize engulfing formations due to their reliability in signaling trend reversals. The bullish engulfing pattern is formed by two candlesticks: a small red bearish candle followed by a larger green bullish candle that completely overlaps the bearish body. This graph appears during downtrends and suggests that bulls have suddenly gained control over market sentiment.
The bearish engulfing pattern works in reverse — that is, when a large red candle completely engulfs the previous green body during an uptrend. This chart indicates that sellers have overwhelmed buyers and may drive prices lower.
The Three-Candle Star Patterns
The Morning Star and Evening Star graphs are some of the most reliable three-candlestick formations in technical analysis. The Evening Star appears at market peaks and consists of three distinct candles: a large bullish one, a small-bodied middle one showing indecision, and a large bearish candle that closes well into the first body.
Studies have shown impressive success rates for these patterns. For example, the success rate of the evening star pattern is usually over 70%. This statistical reliability makes star patterns especially valuable for traders seeking high-probability setups.
Key Bearish Reversal Signals
When markets reach potential turning points, it is especially important to recognize bearish candlestick patterns. Besides the individual Shooting Star and Hanging Man formations, traders should watch for multiple signals that cluster at resistance levels. This combination of pattern convergence often provides stronger reversal signals than isolated formations.
For example, the Dark Cloud Cover pattern exemplifies effective bearish signals. The graph looks like a bullish candle followed by a bearish one that opens above the previous high but closes below the midpoint of the first candle's body. This formation suggests that initial buying enthusiasm was quickly overwhelmed by selling pressure.
Volume Confirmation and Context
Higher trading volume that accompanies bearish formations strengthens the reversal signal and indicates that institutional players participate in the directional change. Patterns appearing at established resistance levels, previous swing highs, or overbought technical indicator readings also carry additional significance.
The integration of momentum oscillators like the Relative Strength Index (RSI) or Moving Average Convergence Divergence (MACD) can provide crucial confirmation when bearish patterns emerge. Overbought readings combined with bearish candlestick formations create compelling risk-reward opportunities for short positions.
Pattern Recognition Tools and Resources
Proficiency in pattern recognition requires consistent practice and quality educational resources, which is why anyone who wants to learn candlestick patterns should start with reliable broker platforms like WR Trading. Such tools can usually offer comprehensive educational resources and practice environments based on real-time market data, pattern recognition tools, and other educational materials, allowing traders to progress from novices to experts using a single resource.
However, one should not forget that global economic factors and political developments can significantly influence market sentiment. While the basic candlestick pattern chart analysis is the first thing on anyone’s study plan, it is important to stay up to date with recent market developments, especially when forex trading is concerned. Besides, it is important to consider the following trade fundamentals.
Risk Management Principles
Professional traders typically risk no more than 1-2% of their account balance on any single trade, regardless of how compelling a pattern appears. This approach might seem overly cautious at first, but it ensures that even a series of losing trades won't significantly impact overall account performance.
Position sizing calculations can account for the distance between entry points and stop-loss levels, and are highly useful for proper risk management. Tighter stop-losses allow for larger position sizes, while wider stops require smaller positions to maintain consistent risk levels.
Entry and Exit Timing Strategies
Even when patterns leave no room for doubt, the timing of entries and exits can seriously impact trading results. Consider these essential timing approaches:
- Conservative entry: Wait for the completion of confirmation candles and enter on the following candle's open.
- Aggressive entry: Enter during pattern formation when key levels are breached.
- Scaled entry: Divide position size across multiple entry points to average into positions.
Exit strategies should be predetermined before entering trades. Profit targets can be set using previous support/resistance levels, Fibonacci retracements, or measured moves based on pattern height. Stop-loss placement typically occurs just beyond pattern extremes, providing a buffer for normal market noise while limiting potential losses.
Common Patterns and Their Success Rates
No one can expect to learn all the available patterns in a day, so traders should always have a candlestick pattern PDF guide at hand and consult it when necessary. Still, there is one more tip to better understand these formations — analyze them historically. Such research, conducted across various markets and timeframes, can provide the most valuable and reliable insights. Here are some performance indicators to consider.
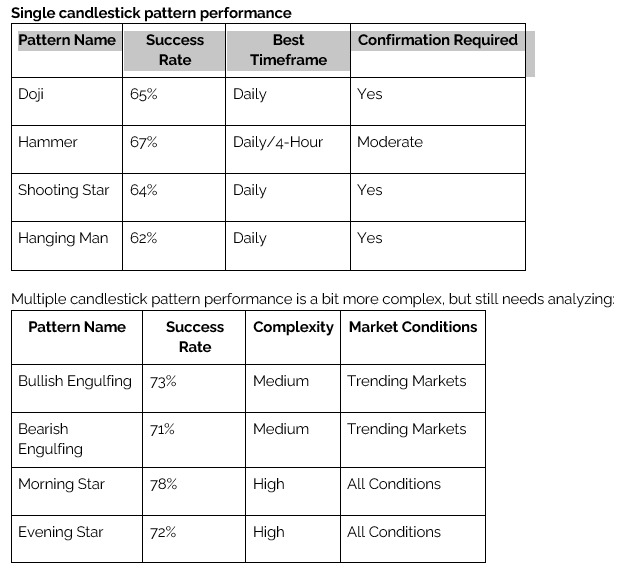
These statistics show general market conditions and may vary based on the timeframe, market volatility, and broader economic conditions. Success rates provide helpful context but should never be the sole factor in trading decisions.
Performance Tracking and Analysis
Maintaining detailed trading records is a must because this is the surest path to continuous improvement, especially in venture capital markets that are heavily influenced by social and political developments. Regular performance analysis should include:
- Pattern-specific results: Track success rates for different formations.
- Timeframe effectiveness: Determine which timeframes produce the best results.
- Market condition performance: Identify optimal trading environments.
- Error pattern recognition: Learn from mistakes to avoid repetition.
This systematic approach to performance tracking transforms trading from a hazardous activity into a professional endeavor with measurable improvement over time.
Conclusion
As we wrap up our exploration of candlestick patterns, let’s be clear about something: beginners love candlestick patterns because they're visual and intuitive — you can literally see the story unfolding on your chart. But here's the catch that many don't realize until it's too late: memorizing patterns is just the entry fee. The real skill comes from understanding when to trust them and when to walk away.
The traders who consistently make money — the ones who are still in the game after years of market ups and downs — share three traits. They respect risk management, they keep their expectations grounded in reality, and they never stop learning. Because in this business, the moment you think you've got it all figured out is usually when the market teaches you otherwise.
Remember - patterns don't guarantee profits, but they do give you an edge. And in trading, that edge might be all the difference between success and becoming another cautionary tale.